
DOC 07VALIDATION
Validation and performance
How LEVIATHAN is checked, what the checks show, and how fast it runs. Every number on this page comes from a recorded run with its raw output kept, on the hardware stated. Where a check was not passed, or has not been done yet, the page says so.
How results are graded
Each result carries an evidence level. The level says what kind of check stands behind the number, so a precise number from a weak check is never mistaken for a strong one.
- Exact references are closed-form solutions: analytic added mass of a spheroid, the integrals behind sonar returns and light scattering, international seawater standards.
- Independent checks compare against a second implementation written separately: a different rigid-body physics engine, an independent reference implementation of the marine-craft equations, the double-precision analytic tier for the GPU.
- Pre-declared criteria are fixed in writing before the run. A result that misses its criterion is recorded as not met, not re-tuned.
- Frozen benchmarks fix tasks, seeds and metrics by content hash, so a later run is comparable to an earlier one.
Physics
| Check | Reference | Result | Level |
|---|---|---|---|
| Axial added mass from geometry | Exact closed-form added mass of prolate spheroids, length-to-diameter 2 to 10 | Within 0.34 % at 90 × 40 panels (criterion ≤ 2 %); error falls with refinement in every series | V1 |
| Lateral added mass, torpedo AUV hull | Equal-volume spheroid theory | 29.92 kg against 29.90 kg: +0.06 % | V0 |
| Mesh integrity | Profile volume of the hull | Mesh volume converges to the profile integral (0.031648 against 0.03165 m³); the solver refuses wrongly wound meshes | V2 |
| Rigid-body core | An independent rigid-body physics engine; 3 s, spin up to 8.6 rad/s | Worst position 1.3 × 10⁻⁸ m, attitude 5.5 × 10⁻⁷ rad, velocity 1.6 × 10⁻⁷ | V2 |
| Coriolis and energy | Independent reference implementation; physical invariants | Coriolis terms agree to 10−12; C + Cᵀ = 0 to 10−12 on 8 vehicles; energy drift 1.6 × 10⁻⁷ without damping | V1 |
| Current coupling (v2 model) | Galilean invariance | Invariant to 2 × 10⁻¹¹ on both tiers | V2 |
| Quaternion attitude option | Exact attitude at pitch-over | Error 3.7 × 10⁻⁸ rad, against 6.3 × 10⁻² for Euler angles | V2 |
| Wave loading on an inspection ROV | Measured forces in a wave basin, 0.5 Hz regular head waves | Amplitude within +9 to +18 %, phase within 3.9–7.3° (criterion ≤ 25 % and ≤ 20°) | V3 |
Sensing
| Check | Reference | Result | Level |
|---|---|---|---|
| Seabed-return imaging sonar | Exact closed-form returns over planar beds | Relative error ≤ 5.8 × 10⁻¹³ (criterion 10−12); total-energy convergence of order 2.01–2.10; no bound violated | V1 |
| Acoustic absorption | An independent implementation of the standard seawater formula | Agreement to 12 decimal places, up to 1 MHz | V1 |
| Underwater in-scatter (v2 optics) | Closed-form integral | ≤ 10−12; the phase function integrates to 1 within 1.3 × 10⁻¹⁰ | V1 |
| Camera geometry | Flat-port refraction, distortion and projection | Within 10−9 to 10−12 | V1 |
| Camera against the World | The World's own seabed | Range difference below 10−9 m | V1 |
| Seawater density | International standard check values, 8 points | Largest difference 4.72 × 10⁻⁶ kg/m³ (criterion 5 × 10⁻⁶) | V1 |
| Pressure to depth | International standard formula | Within 0.54 % to 300 m | V1 |
Navigation
The error-state filter (see Localization) is checked for consistency: whether the uncertainty it reports matches the error it actually makes. These runs use simulated sensors with known truth.
| Check | Result | Level |
|---|---|---|
| Filter consistency, matched noise | Average normalized error 4.41 against a 99 % band of 2.75–10.74; 97 % of epochs inside the band; final horizontal error 0.008–0.033 m | V2 |
| With the filter's noise model independent of the simulator | 4.97, 98 % inside; adding a hard-iron state keeps 4.93 (97 %) where a naive filter reaches 14,061 | V2 |
| Heading after an IMU gap | Heading consistency 0.97 with first-estimate Jacobians, against 9.6 without | V2 |
Agreement between tiers
The GPU tier runs thousands of vehicles at once. It is checked step by step against the analytic tier, which is the reference.
| Comparison | Worst difference | Scope |
|---|---|---|
| GPU tier, double precision on the CPU | 4.5 × 10⁻¹⁶ | 10 vehicles; the canonical World matches bit for bit |
| GPU tier, single precision on CUDA | 2.8 × 10⁻⁶ | 100 steps; position RMS 6.4 × 10⁻⁷ m; 35 parity tests |
| Learning environment tiers | 1.1 × 10⁻⁵ m | CUDA single precision against CPU double precision |
| GPU current model | ≤ 10−9 | Against the World; 2.3 × 10⁻⁶ in single precision |
Evaluation
Controllers and policies are graded on frozen benchmarks. A benchmark fixes its tasks, vehicles, seeds and metrics by content hash; re-freezing an unchanged benchmark produces zero differences, so results months apart are comparable. Every episode is graded with stage attribution: not just pass or fail, but whether the vehicle never engaged, engaged but never acquired the goal, acquired it and then lost it, or succeeded.
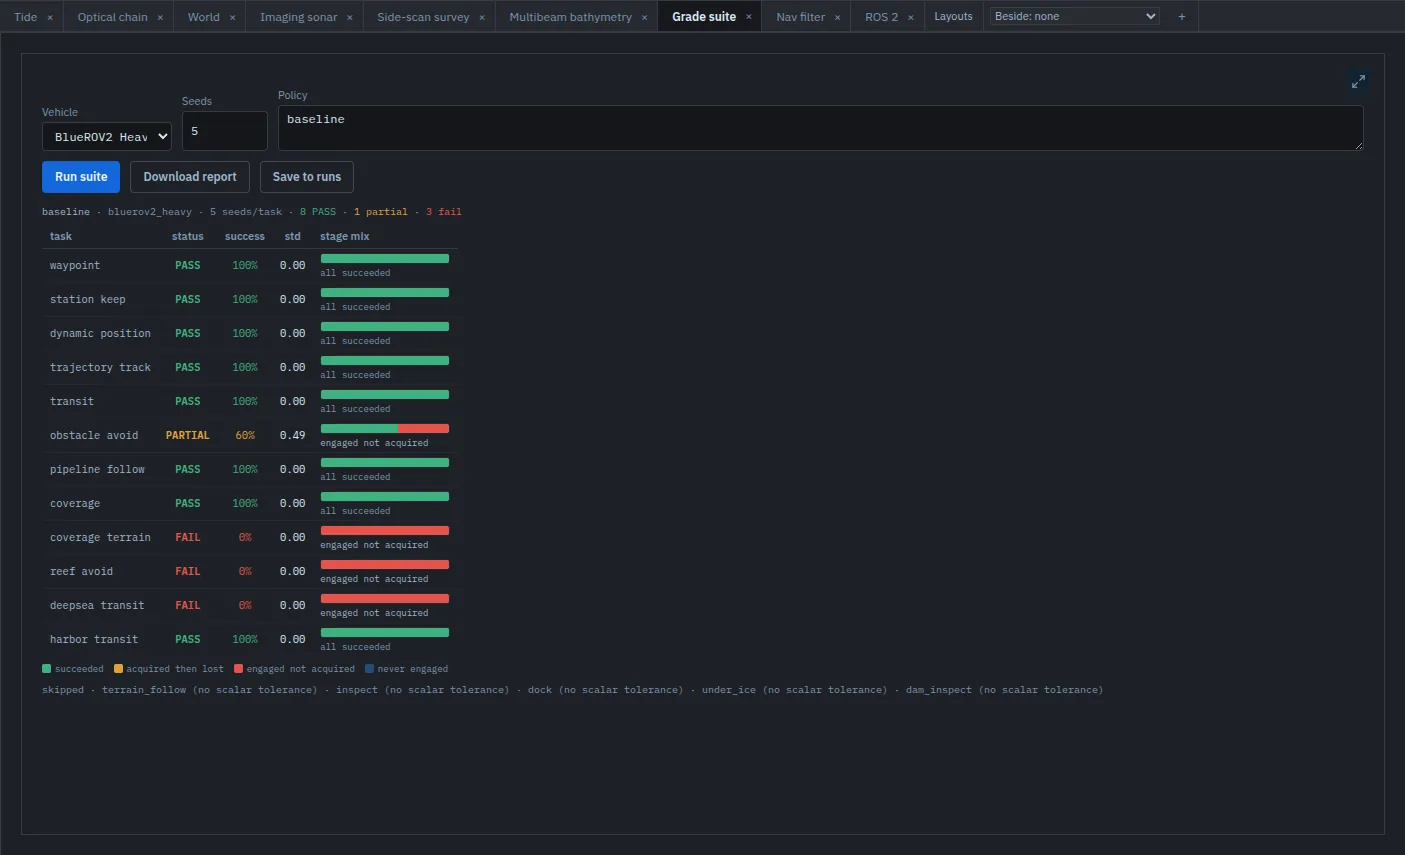
- The benchmark suite has 17 named tasks over 8 vehicle presets, from station keeping and waypoint following to pipeline following, obstacle avoidance and under-ice transit.
- Paired comparisons. A frozen protocol compared three thrust allocators on 20 held-out seeds and 1,920 paired episodes, with paired significance tests and multiple-comparison correction. Task success was identical in 639 of 640 pairs and the alternatives used up to 13 % more energy, so the default allocator was kept. A comparison that finds no improvement is reported as such.
- Reproducible training. A full GPU training run completed 300 of 300 updates in 283 s, and its first 60 updates were bit-identical to a separate run.
Performance
All figures were measured on one laptop: a 32-thread laptop processor, 62 GB of memory and a consumer laptop GPU with 8 GB of memory, single precision on the GPU. Each is a median of repeated trials.
| What is measured | Rate | Conditions |
|---|---|---|
| Batched physics | 10.25 M steps/s | 65,536 vehicles, commands kept on the GPU; 6.22 M at 16,384 and 1.56 M at 4,096 |
| Batched physics, commands from the host | 4.61 M steps/s | 65,536 vehicles; 2.93 M at 16,384, 1.19 M at 4,096 |
| Full learning environment | 1.29 M env-steps/s | 4,096 environments; observation, reward and reset included; random actions (five trials, 1.275–1.298 M) |
| Same, with the policy in the loop | 0.93 M env-steps/s | 4,096 environments |
| End-to-end training | 0.24–0.30 M transitions/s | Including policy updates; the configuration used for training runs at 0.66 M env-steps/s |
| One vehicle on the CPU | 145 µs per step | About 344 × real time at a 0.05 s step |
| World view | 16.7–16.8 ms | 95th-percentile frame time in all nine scenes (60 fps, vertical sync) |
Environment-step rates are not training speed: training spends most of its time updating the policy. The end-to-end figure is the one to plan with.
Software quality
Release 0.8.0 shipped after these suites passed on the release build:
| Suite | Result |
|---|---|
| Application unit tests | 163 files, 0 failures |
| CAD with the bundled kernel, Hull, Hull routes and world assets | 293 passed |
| CAD kernel suite | 240 passed: golden volumes, areas and bounds for imports, holes, booleans, inertia against closed forms, sweep volume within 0.5 %, exported meshes re-read within 2 × 10⁻³ |
| Desktop application end-to-end | 22 passed and 33 passed in its two suites |
| Hardware end-to-end | 11 and 55 passed in its two configurations |
| CAD in the browser | 10 passed |
| Installed packages smoke test | Passed for both packages |
| Full backend regression (1 November 2026) | 11,538 passed, 0 unexpected failures; 21 failures are the recorded historical benchmark freezes, kept on purpose |
Known limits
- Physical validation is narrow so far. The one physical pass is wave loading on one inspection ROV at one frequency. Steady drag for that vehicle is over-predicted, about 3.4 times in the measured cases, and its yaw response misses its criterion. Treat absolute drag and thrust as estimates.
- No sensor model has yet been compared with real sensor data. The sonar, optics and navigation results above are numerical checks against exact references and simulated truth.
- Some validated models are opt-in. The v2 current model, v2 optics and the seabed-return sonar are validated but not yet the defaults; the application's sonar view and its navigation panel use the earlier models.
- The sonar per-cell criterion (agreement of each image cell with the closed form at coarse sampling) was not met: errors are 0.2–3.6 % per cell, while totals converge at second order.
- Statistics are still small in places: some navigation and mission results rest on three seeds or one.
- Performance comes from one laptop. Other hardware has not been measured.
The model-by-model limits are on each topic's page and in Conventions and glossary.