
DOC 02WORKSPACES
Hull workspace
The Hull workspace is the marine-engineering workspace in LEVIATHAN. It has two modes. Design is a naval-architecture view of a hull: lines plan, offsets, hydrostatics, curves of form, a GZ stability curve checked against the IMO 2008 Intact Stability Code, and friction resistance. Operations is the planner for robots that work on a ship's hull: it grows fouling along a trading pattern, estimates what that costs in power, fuel and carbon, and plans how simulated hull-cleaning robots would clean and inspect it. The Design / Operations switch is at the top left.
Design mode
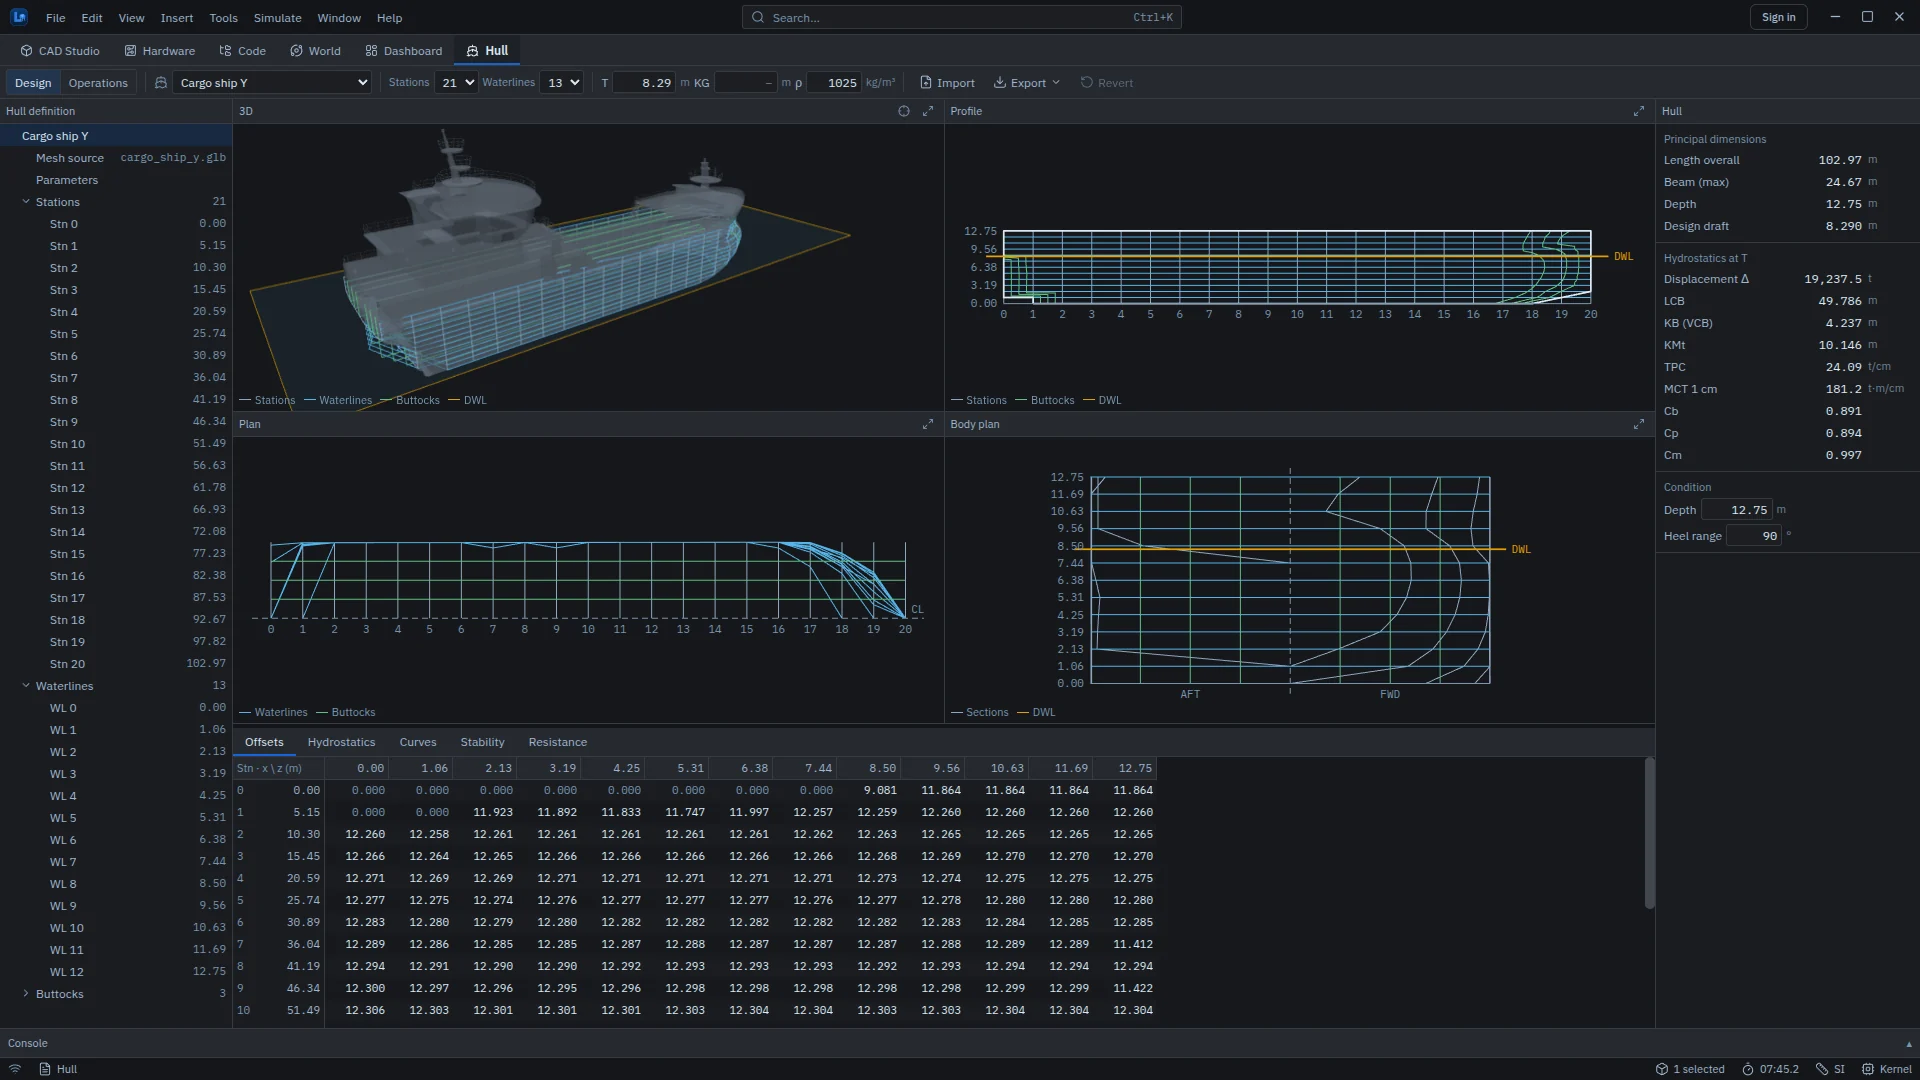
- Toolbar. Hull (a library ship), number of stations (11, 21 or 41) and waterlines (9, 13 or 21), design draft T, KG and water density ρ, Import and Export of the offsets as CSV, and Revert to put the offsets back to the mesh. A status chip reports errors, with details in a popover.
- Hull definition tree. The hull, its mesh source and parameters, and every station, waterline and buttock (at 25, 50 and 75 % of the half beam). Click a line, in the tree or in a view, to select it.
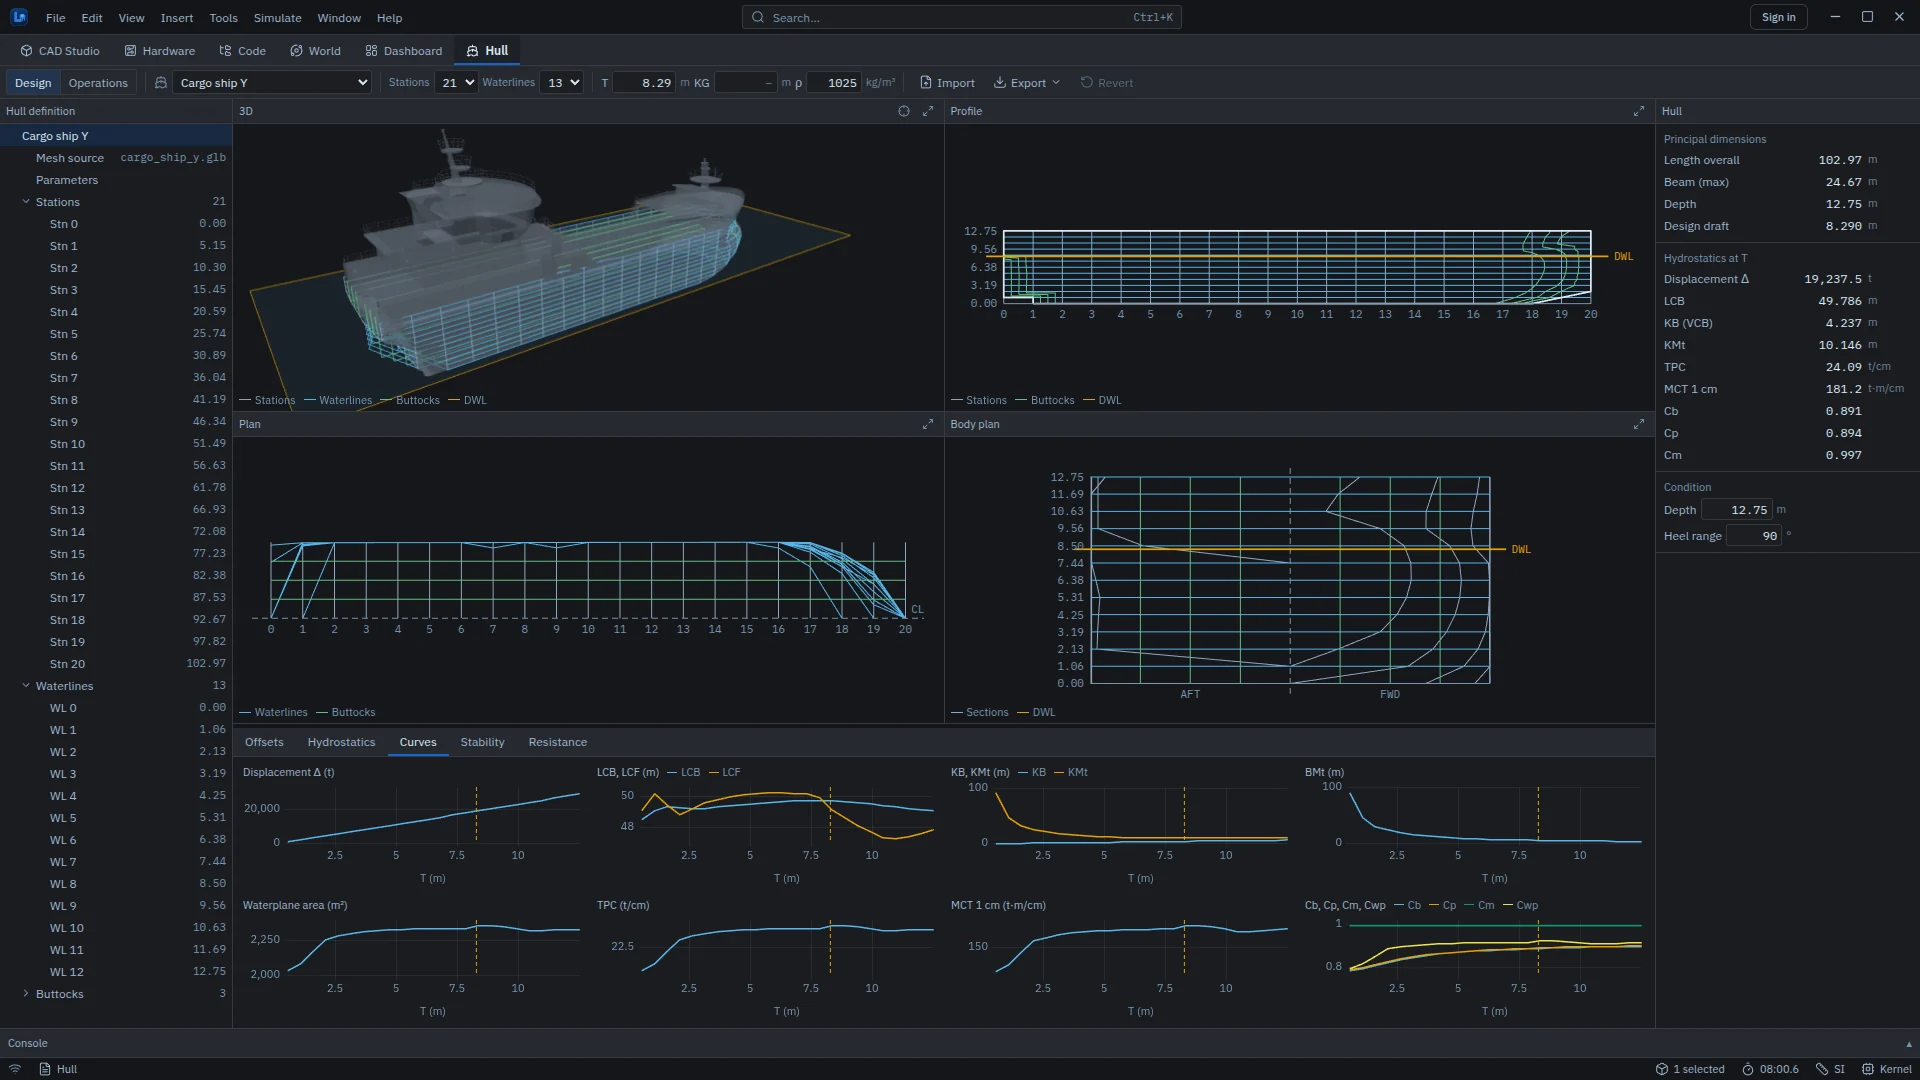
- Views. 3D (mesh, lines and the design waterplane), Profile (stations, waterlines, buttocks, outline and design waterline), Plan (port half-breadths, centreline dashed) and Body plan (aft sections on the left, forward on the right). The wheel zooms, drag pans and double-click resets. Each pane maximizes.
- Properties. Principal dimensions, hydrostatics at T, depth and heel range, and the details of the selected station, waterline or buttock.
| Tab | Contents |
|---|---|
| Offsets | Editable half-breadths for every station and waterline. CSV import and export: a header row x\z, z0, z1, …, then one row x, hb0, hb1, … per station |
| Hydrostatics | Values at the design draft, and a table over 24 drafts |
| Curves | Displacement, LCB and LCF, KB and KMt, BMt, waterplane area, TPC, MCT 1 cm and the form coefficients, plotted against draft |
| Stability | GZ against heel at constant displacement and fixed trim, with GZmax, angle of vanishing stability, the GM slope and the area from 0 to 40° shaded; pass or fail for the IMO 2008 IS Code general criteria (Part A 2.2); downflooding angle θf |
| Resistance | Frictional resistance and effective power from the ITTC-1957 friction line (friction only) |
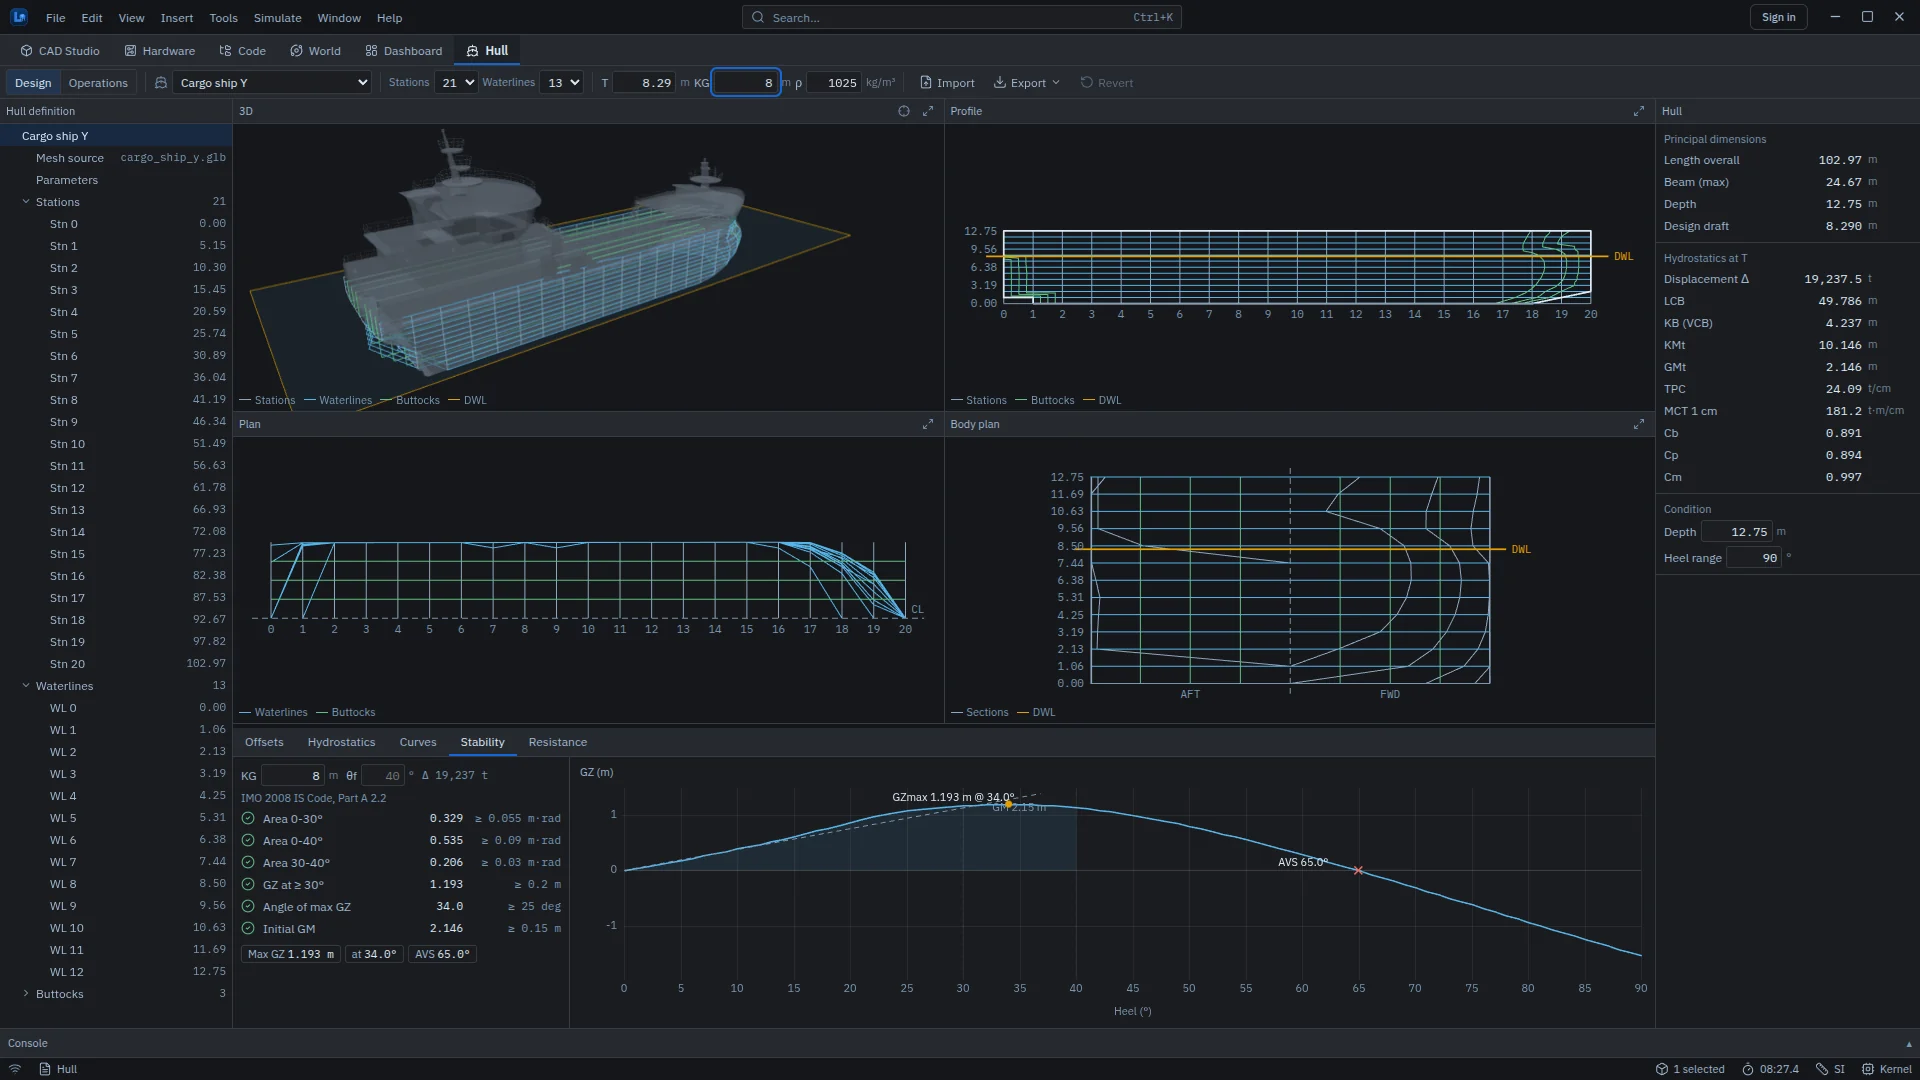
The stability check needs a KG, which the hull does not carry. Enter it in the toolbar or in the Stability tab; the KG in Figure 5.3 is an example value, not a loading condition of a real ship.
Method. The offsets are the outer envelope of the mesh, with openings bridged and topsides carried up to the depth. The hydrostatics integrate the closed linear loft of the offsets. Volume, CB and wetted area use the same integral as the World physics, and Operations mode uses the same backend hydrostatics, so there is one displacement everywhere. Every number comes from the simulation service, not from the interface.
Export. A hull can be exported as GLB, as STL for CAD Studio, or as offsets CSV. Export ▸ To World places it in the World as a world asset that floats at its draft and that vehicles collide with (see Export to World).
Operations mode
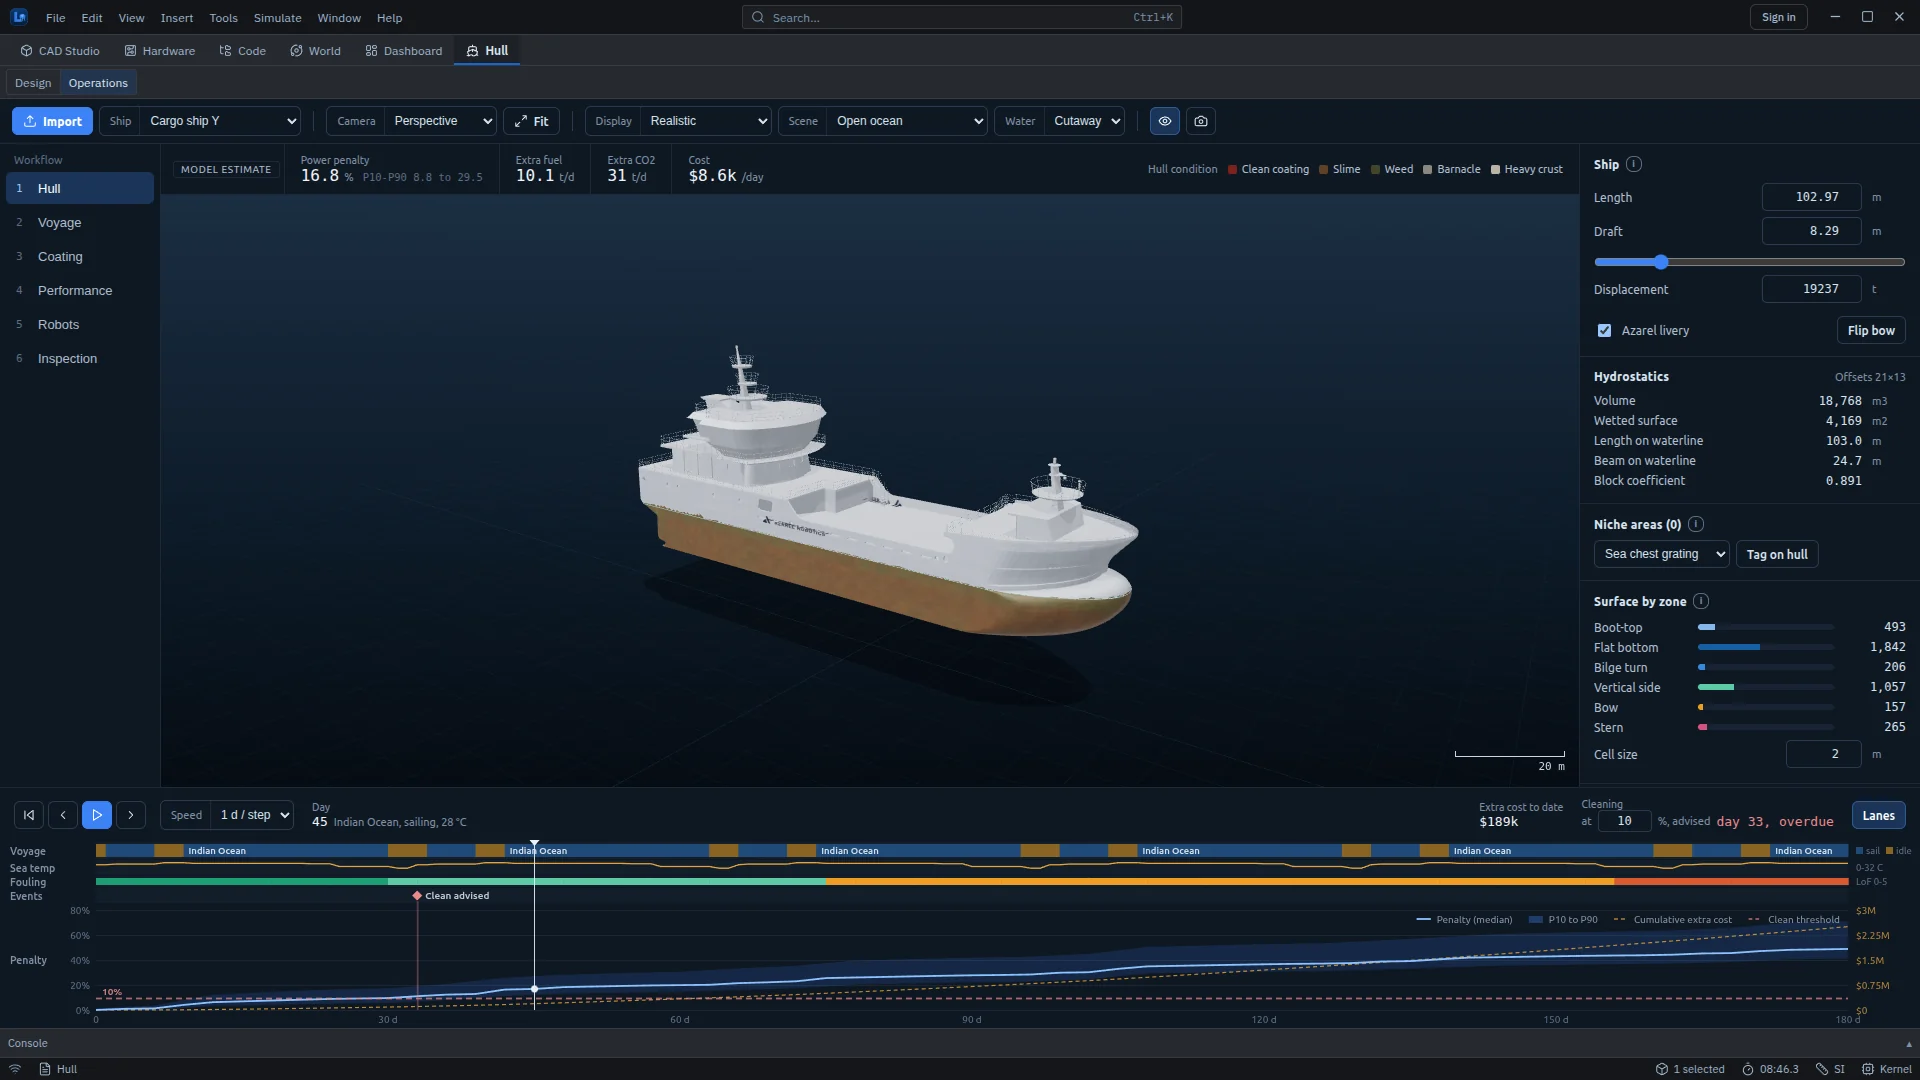
- Toolbar. Import a hull; choose a ship (cargo ship, cargo vessel with cranes, general cargo ship, ocean bulk carrier or shallow-draft icebreaker); camera view; display mode; scene; water shown cut away or as a surface; screenshot.
- Display modes. Realistic, Cleaning progress, Fouling level, Roughness, Hull zones, Curvature and Niche areas.
- Scenes. Open ocean, anchorage, port quay, ice field, dry dock and offshore platform, plus the structures from the World's scene library.
- Workflow on the left: six steps from Hull to Inspection.
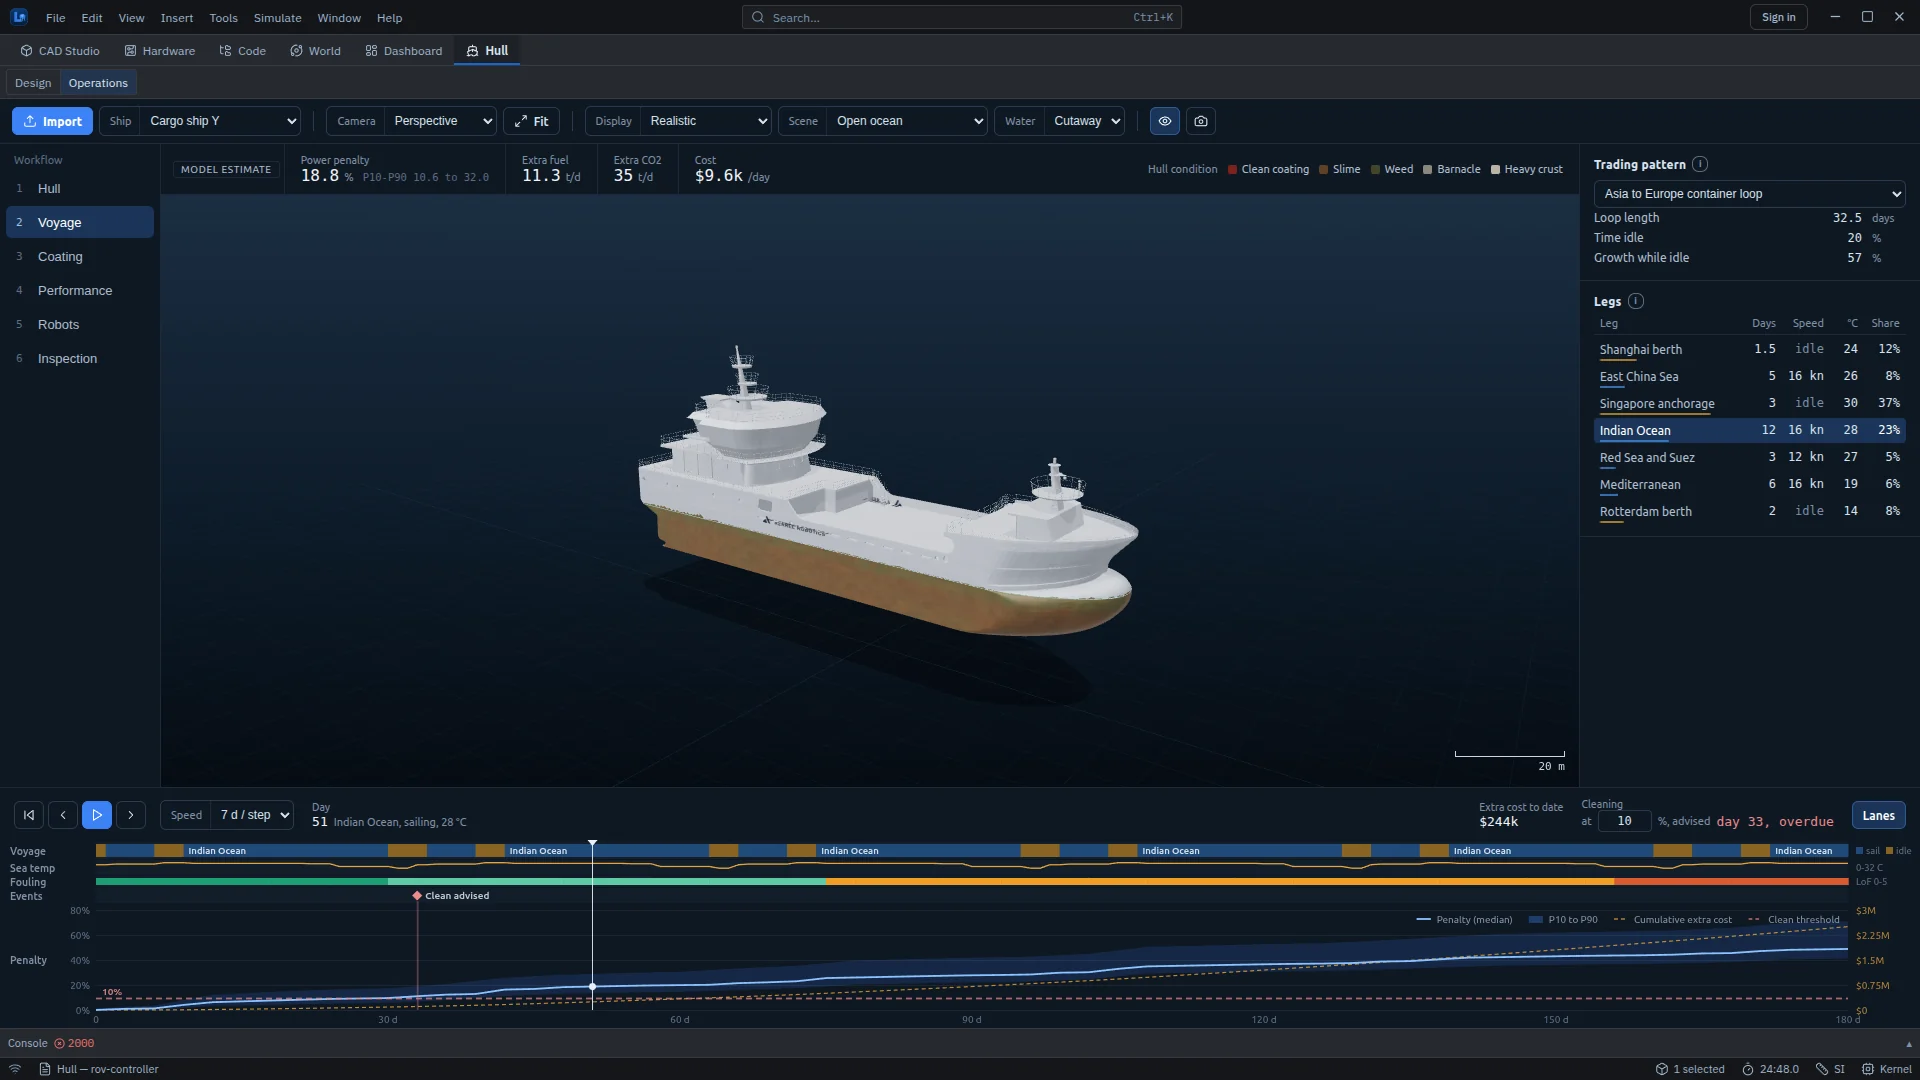
- Timeline at the bottom: play through the voyage one, three or seven days at a time, or click a day.
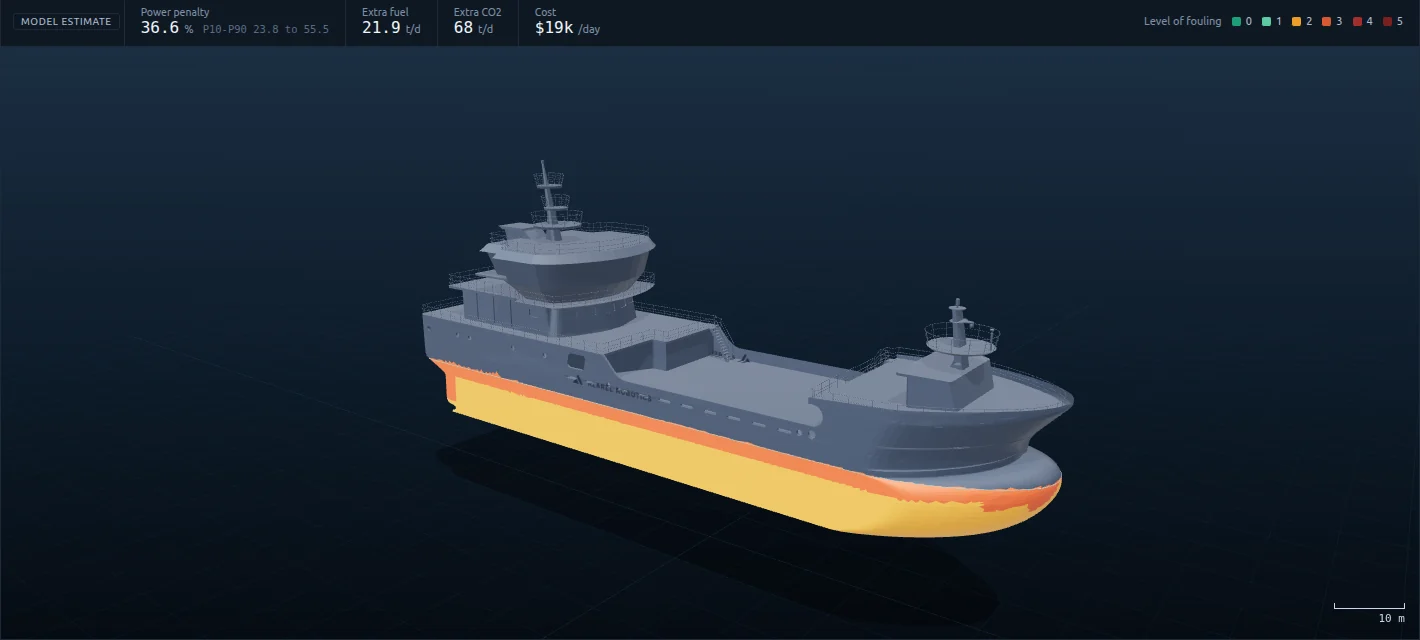
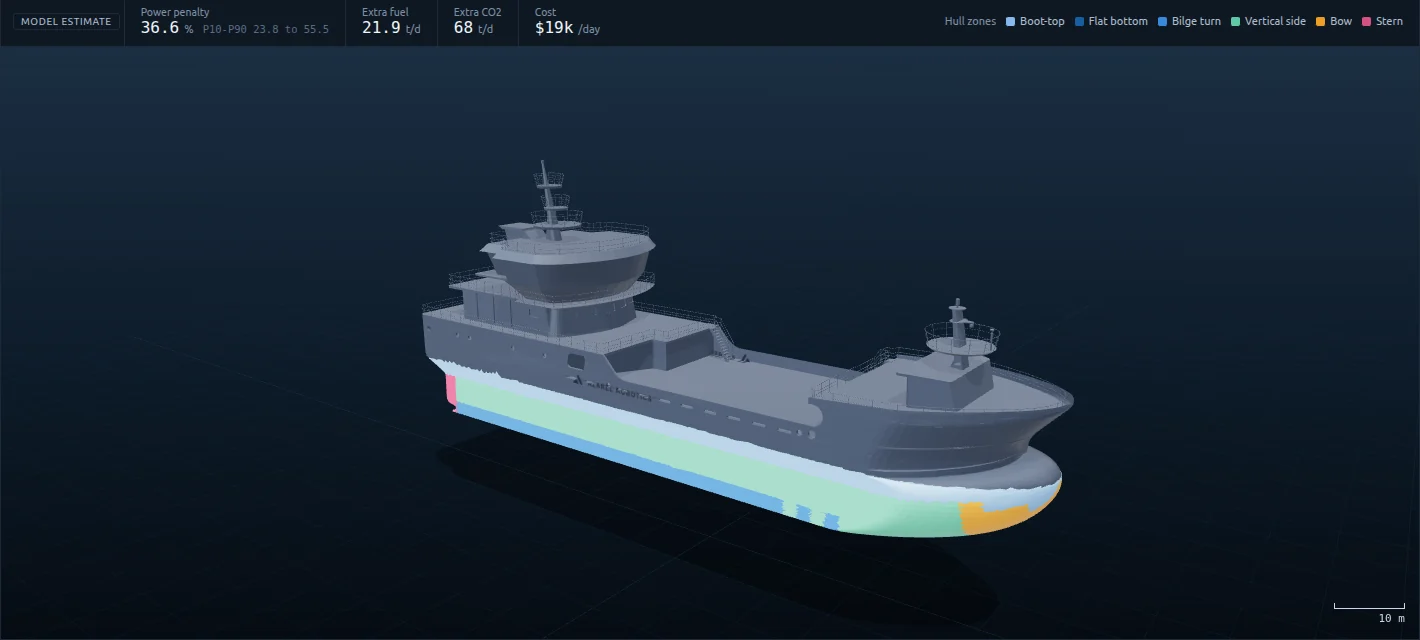
The six Operations steps
1 · Hull
Set length, draft and displacement. The workspace computes hydrostatics from the mesh (wetted surface, waterline length and beam, block coefficient) and builds the hull atlas. The atlas is a grid of cells over the wetted surface, addressed by station along the length and by a polar girth coordinate from port waterline through keel to starboard waterline. Every later step addresses the hull through it, and each cell carries its measured area. Niche areas, such as sea-chest gratings, thruster tunnels, propeller, rudder, bilge keels, anodes and transducers, can be tagged on the hull. Wetted area is reported by zone.
2 · Voyage
Choose a trading pattern or write your own. Built-in patterns are an Asia–Europe container loop, a Singapore anchorage wait, a Baltic RoPax shuttle, a US Gulf tanker with anchorage waits, and an FPSO on station without dry-docking. A pattern is a loop of legs, each with a name, duration in days, speed in knots (zero means idle), sea temperature and salinity. The panel reports loop length, time idle and the share of growth that happens while idle.
3 · Coating
Choose the coating and its age since dry-docking. Options are copper self-polishing antifouling, silicone foul-release, a biocide-free hard coating, and a grooming-matched self-polishing coating. Each coating specifies its growth factors while idle and while sailing, its as-applied roughness and the maximum cleaning shear it tolerates. A comparison table shows each coating's penalty on the current day and when it would need cleaning on this voyage.
4 · Performance
See where the penalty comes from (hull friction and an indicative propeller term) and what fouling costs over the next 30 and 90 days, since cleaning fell due, and per year at today's rate. Operating assumptions are editable: service speed, sea temperature for drag, friction share of total resistance, clean-hull fuel use, fuel type (HFO, LFO, MDO, LNG or methanol), fuel price and carbon price.
5 · Robots
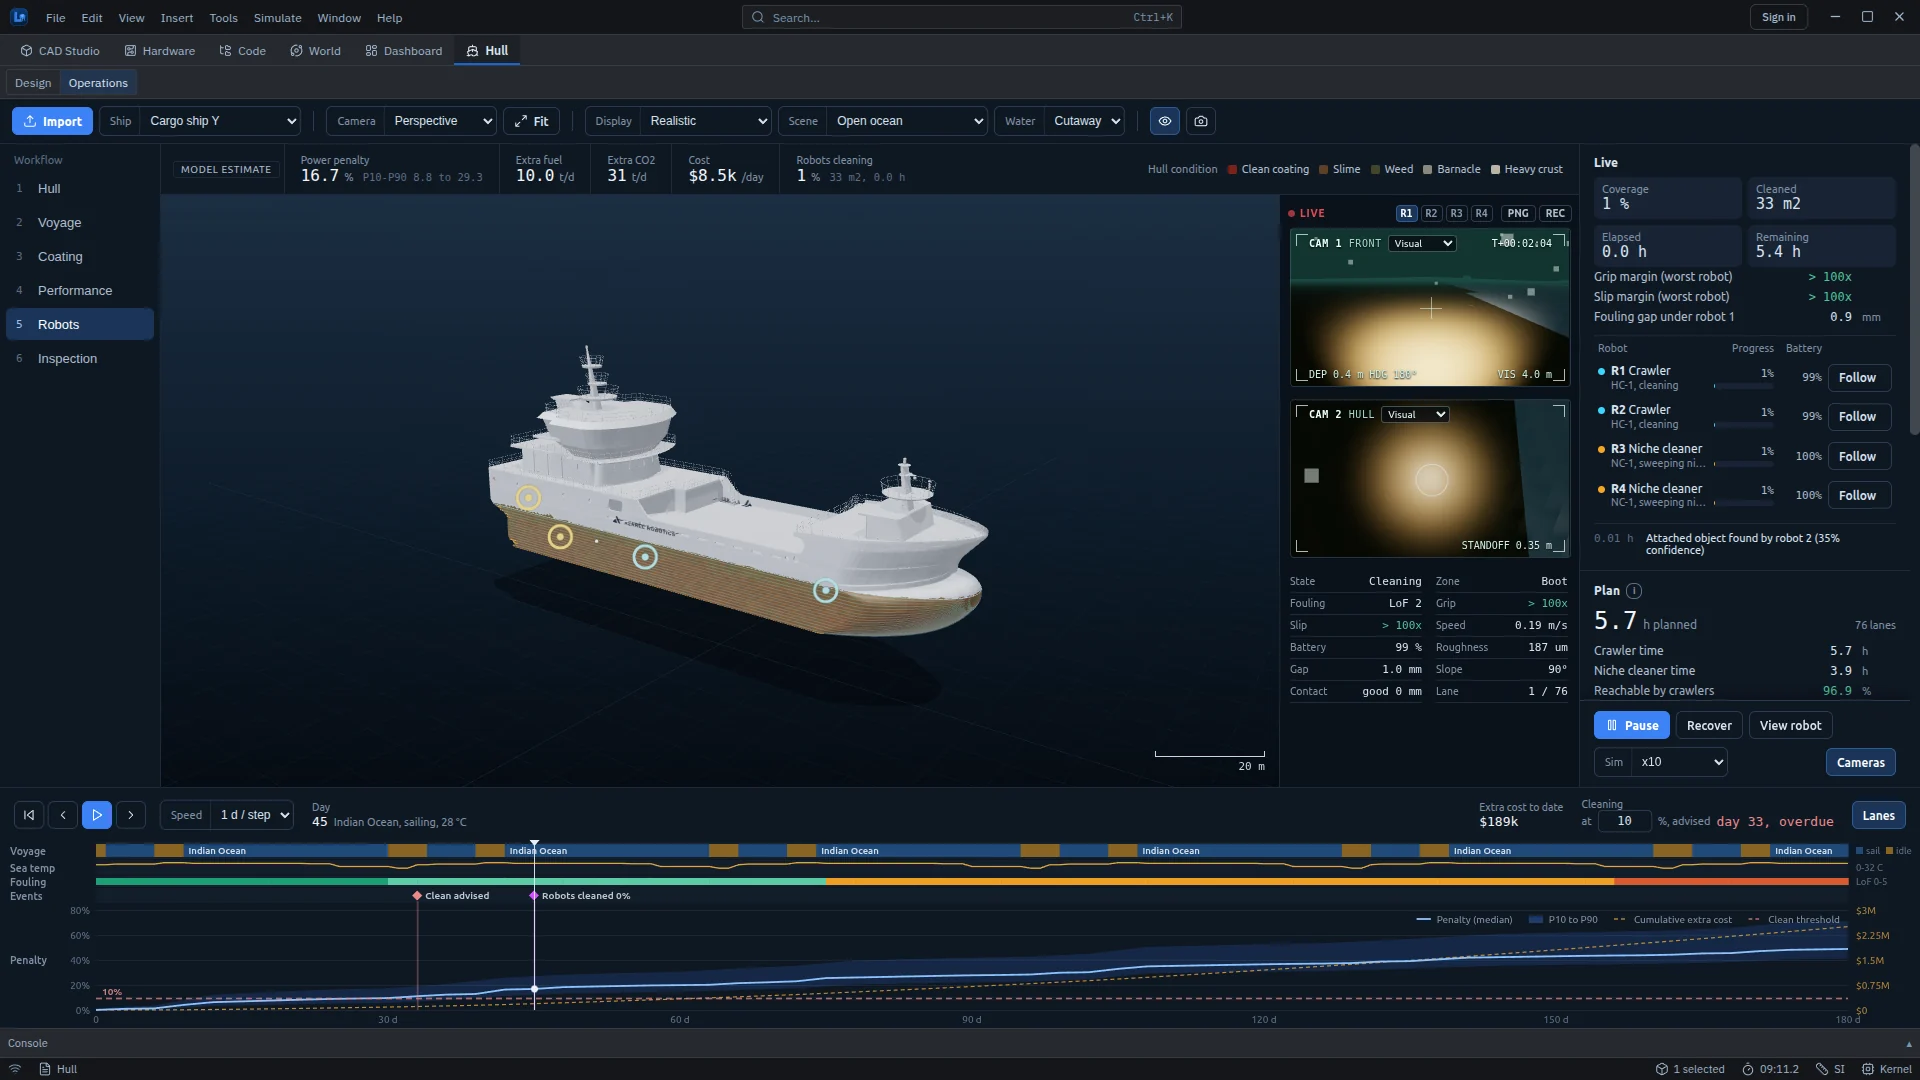
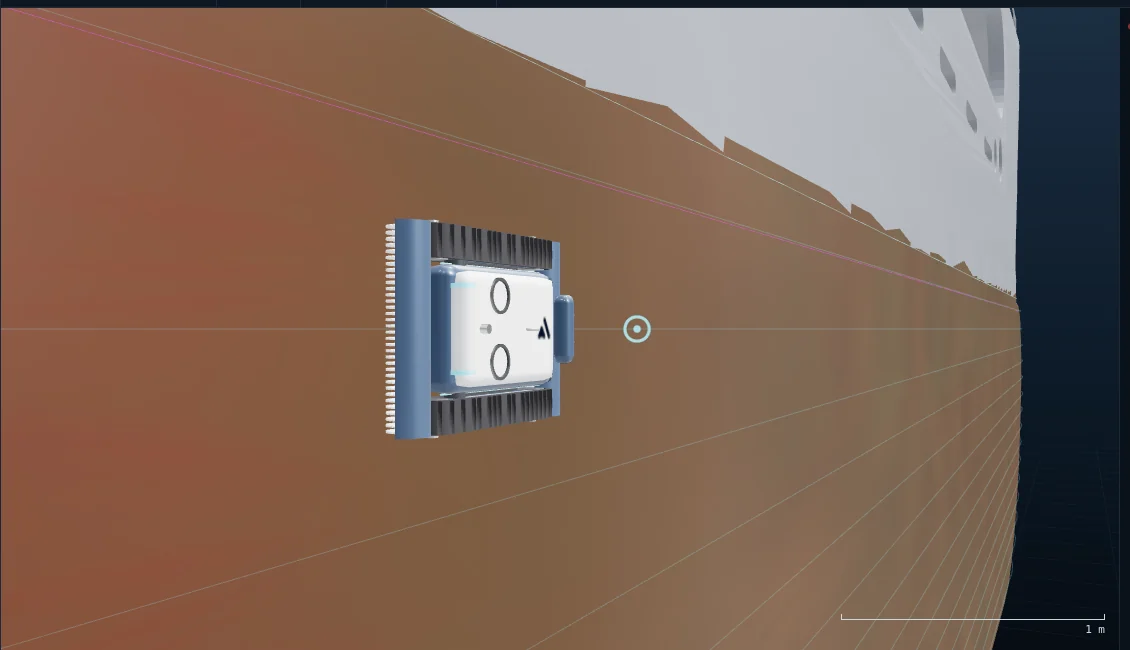
Plan and run a cleaning or inspection mission with a fleet of simulated hull crawlers (HC-1) and niche cleaners (NC-1). These two robots are Azarel concept designs: the workspace models their geometry and behaviour, but they have not been built or tested, and their parameters are design targets. The plan reports total hours, the number of lanes, crawler and niche-cleaner time, the share of the hull crawlers can reach, and no-go lengths caused by openings, tight curvature and obstructions. The mission sets the task (clean, inspect, or both), brush type, area and sides. Deploy stages the robots on the hull. Live camera views and per-robot status then show progress, grip margin and battery.
6 · Inspection
Each hull carries seeded defects: coating breakdown, corrosion pitting, dents, weld cracks, depleted anodes and attached objects. Robots with an inspection task find them with a detection probability per look, which falls with range, turbidity and fouling cover. Because the simulator knows every seeded defect, Show undetected (ground truth) reveals what the survey missed.
Models
| Model | Method | Scope |
|---|---|---|
| Fouling growth | A phenomenological "fouling dose" per atlas cell. Dose rate = Q10(T−20)/10 × salinity factor × (idle or sailing coating factor) × ageing factor, with Q10 = 2. Light near the waterline and niche geometry also count | Not a biological population model. The dose-to-roughness mapping is calibrated to the order of standard fouling categories, not fitted to a vessel |
| Roughness | Dose maps to an equivalent sand-grain roughness ks and a level-of-fouling rank | Indicative |
| Friction penalty | Similarity-law scaling from a smooth-plate friction line and a sand-grain roughness function, flat-plate equivalent over waterline length, area-weighted over atlas cells | Leading-order. Position along the hull is ignored. Form factor and wave resistance are held at clean values. Increments fall within about 1.5× of the published trend for a frigate-length hull |
| Uncertainty | P10/P50/P90 from lognormal uncertainty in growth rate and in the dose-to-roughness mapping | Sampled per day |
| Propeller | Propeller roughness grade A–F from a propeller dose, mapped to an efficiency loss | Indicative only |
| Robot adhesion and motion | Permanent-magnet pull decaying with the gap (coating plus fouling), against wet weight, flow drag and lift; Coulomb friction for slip; lanes of constant girth snapped to the mesh | No track dynamics, contact solver or magnet saturation in this workspace |
| Cleaning | Brush footprint credited to the atlas cell beneath; removal by fouling stage, leaving a residual; regrowth restarts on cleaning day | Plume transport not modelled |
| Inspection | Detection probability per look as a function of range, turbidity and fouling cover | Seeded defects with known ground truth |
Importing a hull
Import opens a review step before a mesh becomes the hull. You choose which parts to keep, confirm the units (guessed from the ship's longest dimension, and always shown for you to change), and check whether the surface is closed. Small openings, such as a missing plate or an open sea chest, can be filled. Large or strongly non-planar openings are reported, not filled. Nothing is changed without being shown first.
The Hull workspace is an analytic decision aid. Its penalties, costs and cleaning dates are indicative estimates from published methods and stated assumptions, with uncertainty bands. They are not predictions for a specific vessel and have not been fitted to fleet data.