DOC 02WORKSPACES
Dashboard
The Dashboard has two views, switched at the top right. Analysis is a dockable grid of plots, tables and gauges driven by message paths and a shared timeline, in the style of robotics log tools. Tools holds the catalogue of 85 analysis panels for sensors, physics, charts, estimation, evaluation and interfaces, the tools that once had their own tabs. Most Tools panels run the analytic tier, so they are fast enough to explore interactively.
Analysis
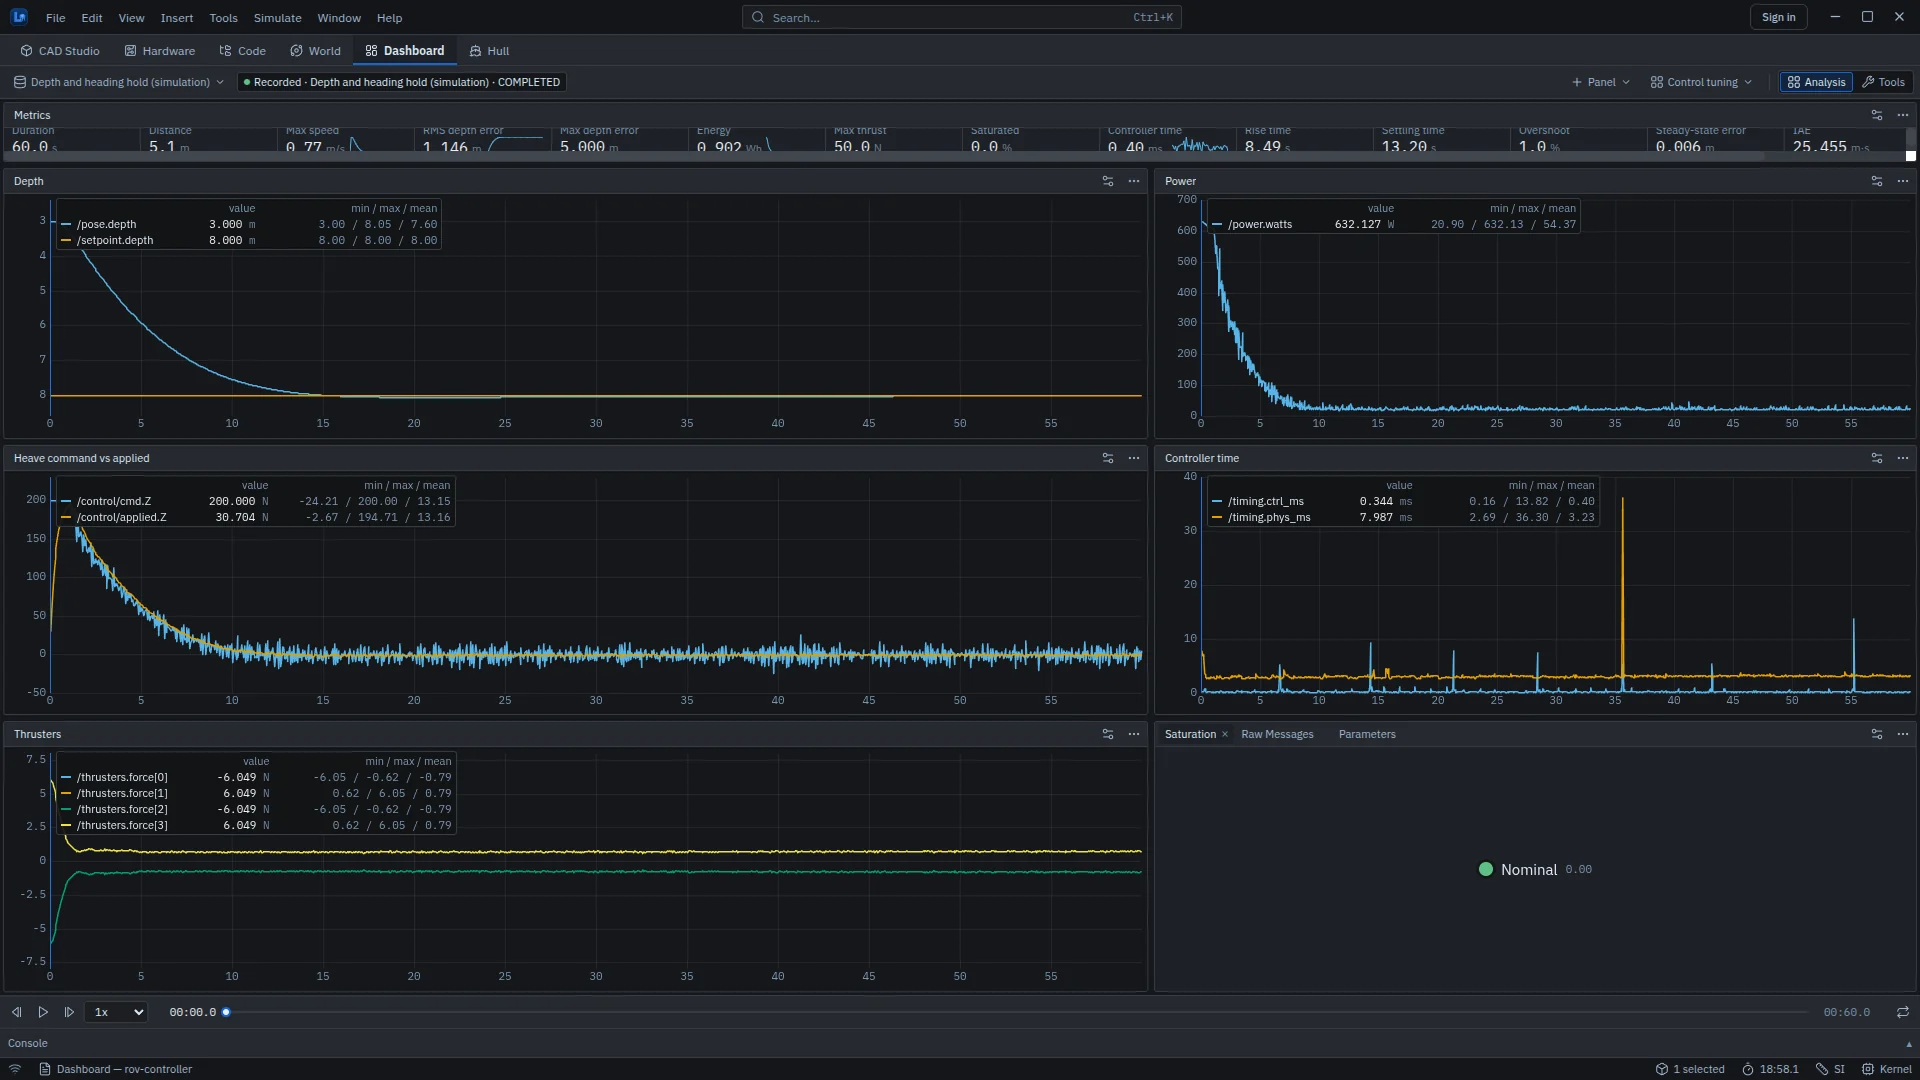
- Source, top left: World (the live bus from the World workspace), SITL (live, over WebSocket), Simulation runs (controller simulations of the open Code project, live while running), Import CSV or log, and Demo. Demo trajectories are synthesized and always labelled as such.
- Layouts. Four defaults, Live run, Episode review, Sensors and Control tuning. Layouts are saved per project: save as a copy, duplicate, rename, import and export as JSON, or reset to the default.
- Panels dock, split, tab, drag to rearrange and maximize. + Panel adds one.
- Timeline, bottom: Space plays and pauses, Left and Right step (Shift for 1 s), Home and End jump, speed runs from 0.25× to 10×, Shift-drag on the bar sets a loop range, and Live follows the newest data.
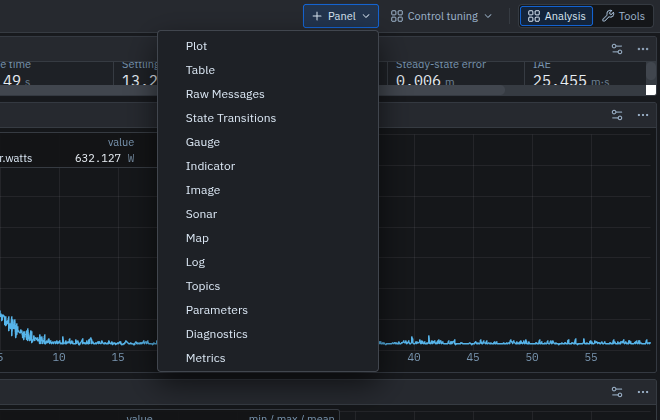
| Panel | Shows |
|---|---|
| Plot | Series against time, with a synchronised crosshair, zoom and pan, a min/max/mean legend, and PNG and CSV export. Click seeks; drag or the wheel zooms; Shift- or Ctrl-wheel pans; double-click resets; clicking a legend entry hides that series |
| Table | Messages as rows, up to 100,000 |
| Raw Messages | One topic's latest message as a tree |
| State Transitions | A discrete value, such as a mode, as bands over time |
| Gauge, Indicator | One value on a dial, or a coloured state such as saturation |
| Image, Sonar, Map | Camera frames, sonar images, and the track in plan view |
| Log, Topics, Parameters, Diagnostics | Log lines, the topics in the source, run parameters, and diagnostics |
| Metrics | A row of run metrics, each shown only when its inputs exist: duration, distance, maximum speed, RMS and maximum depth error, path-tracking error (needs waypoints), energy (Wh, from power), maximum thrust, time saturated and mean controller time; for controller simulations, the service's step-response metrics |
Message paths select a field as /topic.field or an array element as /topic.array[2], for example /pose.depth, /control/cmd.Z or /thrusters.force[0].
| Topic | Fields |
|---|---|
| /pose | north, east, depth (m); roll, pitch, yaw (deg) |
| /velocity | u, v, w, speed (m/s); p, q, r (deg/s) |
| /setpoint | depth (m), heading (deg) |
| /control/cmd, /control/applied | X, Y, Z (N); K, M, N (N·m); saturated |
| /thrusters | force[i] (N) |
| /power | watts |
| /timing | ctrl_ms, phys_ms |
| /sensor/pressure | pressure_pa, depth |
| /controller/debug | whatever the controller reports |
| /world | motion_source, mode, vehicle |
The World source follows the World workspace's live bus. In this release it stops updating while the World workspace is not the visible tab, so for a run you want to analyse in full, use a controller simulation (Simulation runs) or an imported log.
Tools
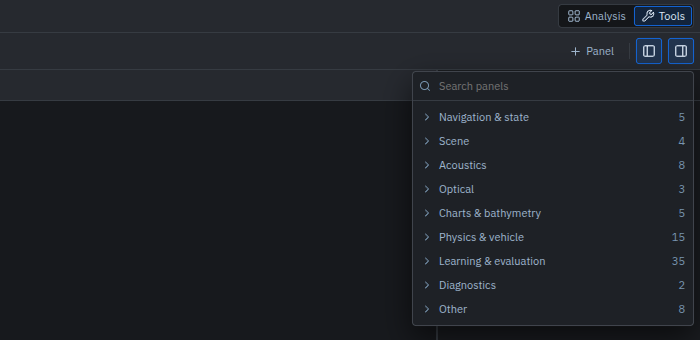
Nothing from the earlier Dashboard was removed: its panel catalogue lives in Tools, and Tools opens by itself when another workspace asks for one of its panels.
Tools layout
- Source, top left: the data the panels follow. By default this is live · viewport, the World's vehicle sampled ten times a second. A device registered with the remote device gateway can also be chosen.
- Panel tabs in the centre. The left sidebar holds the selected panel's settings and title override, with export, import and reset. It also has Topics and Problems tabs.
- Right sidebar: Variables, Events, Layouts and Recordings.
- Timeline, bottom: step, play, loop and playback speed, plus event markers.
Tools panel catalogue
| Group | Panels | Panels |
|---|---|---|
| Navigation & state | 5 | Pose vs time · Speed vs time · Depth gauge · State readout · Frames |
| Scene | 4 | Seabed · Scene entities · Survey areas · World |
| Acoustics | 8 | Sonar: Forward sonar · Imaging sonar · Side-scan review Water column: Sound-speed profile · Echogram · Hydrophone Positioning: Beacons · Acoustic comms |
| Optical | 3 | Camera (live) · Camera projection · Optical chain |
| Charts & bathymetry | 5 | Chart · Coverage chart · Soundings · Tide · Ocean field |
| Physics & vehicle | 15 | Cards: Dynamics run · Side-scan survey · Multibeam bathymetry · USBL positioning · LBL positioning · Camera visibility · GPS surface fix · Stereo vs depth range · Import bathymetry · Tether catenary · Cable dynamics Planning: Survey coverage · Mission · Hull hydrodynamics · Traffic |
| Learning & evaluation | 35 | Reinforcement learning · Run verdict · Training runs Grading: Task suite · Grade suite · Segmentation grade · Detection grade · Robustness bench · Public benchmark · Compare runs · Regression Estimation: Nav filter · Cooperative localisation · SLAM eval · System ID · External frames Sensor models: Thermal camera · Optical flow · Event camera · LiDAR · Visible-light comms Fleet & behaviour: Boids · Cooperative survey · Coordination · Intervention · Manipulator Robustness: Scenario · Disturbance observer · Robustness ladder · Current sweep · Domain randomisation · Parameter sweep Policy: Distillation · Policy export · Synthetic data |
| Diagnostics | 2 | Performance · Problems |
| Other | 8 | Viewport (live) · Viewport live · ROS 2 · SITL / HIL · Replay · Author · Scenario graph · Project |
Representative Tools panels
Side-scan survey and multibeam bathymetry
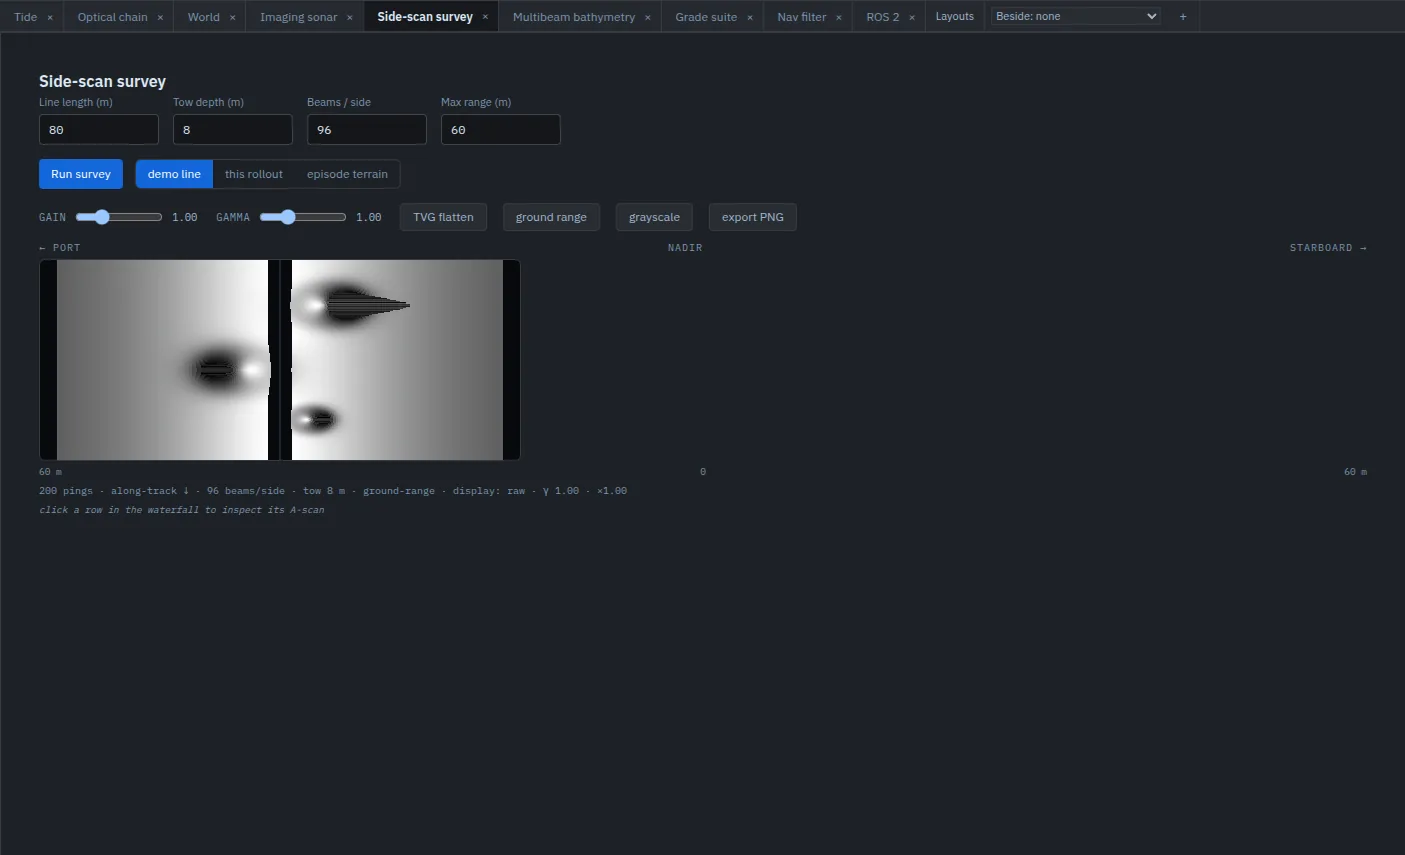
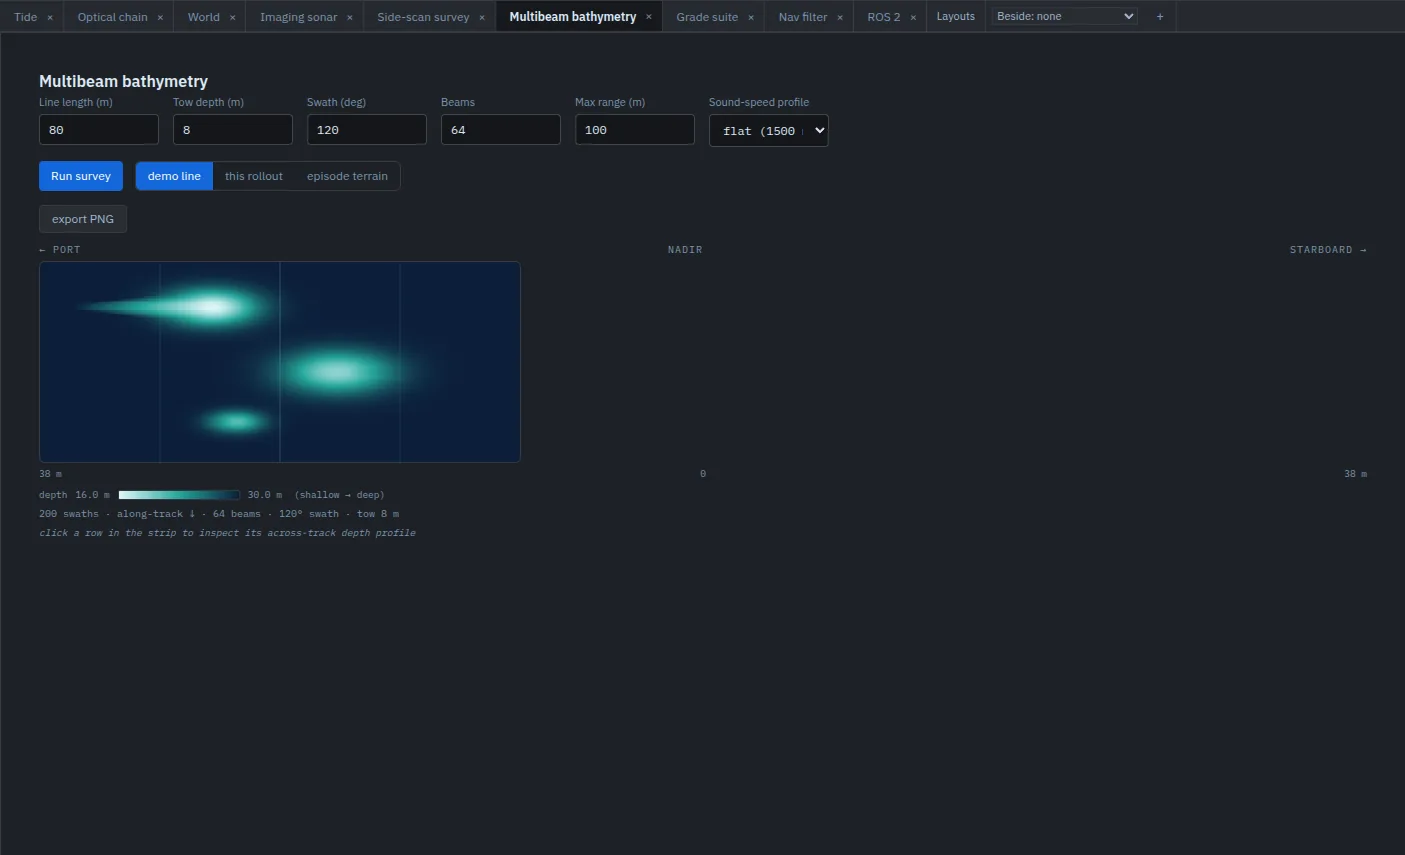
Survey cards fly a line over a seabed and build the sonar product. The side-scan waterfall has port and starboard channels, gain and gamma, time-varied-gain flattening, ground-range correction, and an A-scan for any ping. The multibeam strip shows depth across the swath and lets you choose the sound-speed profile: flat 1500 m/s, summer thermocline, Munk deep channel or coastal.
Optical chain
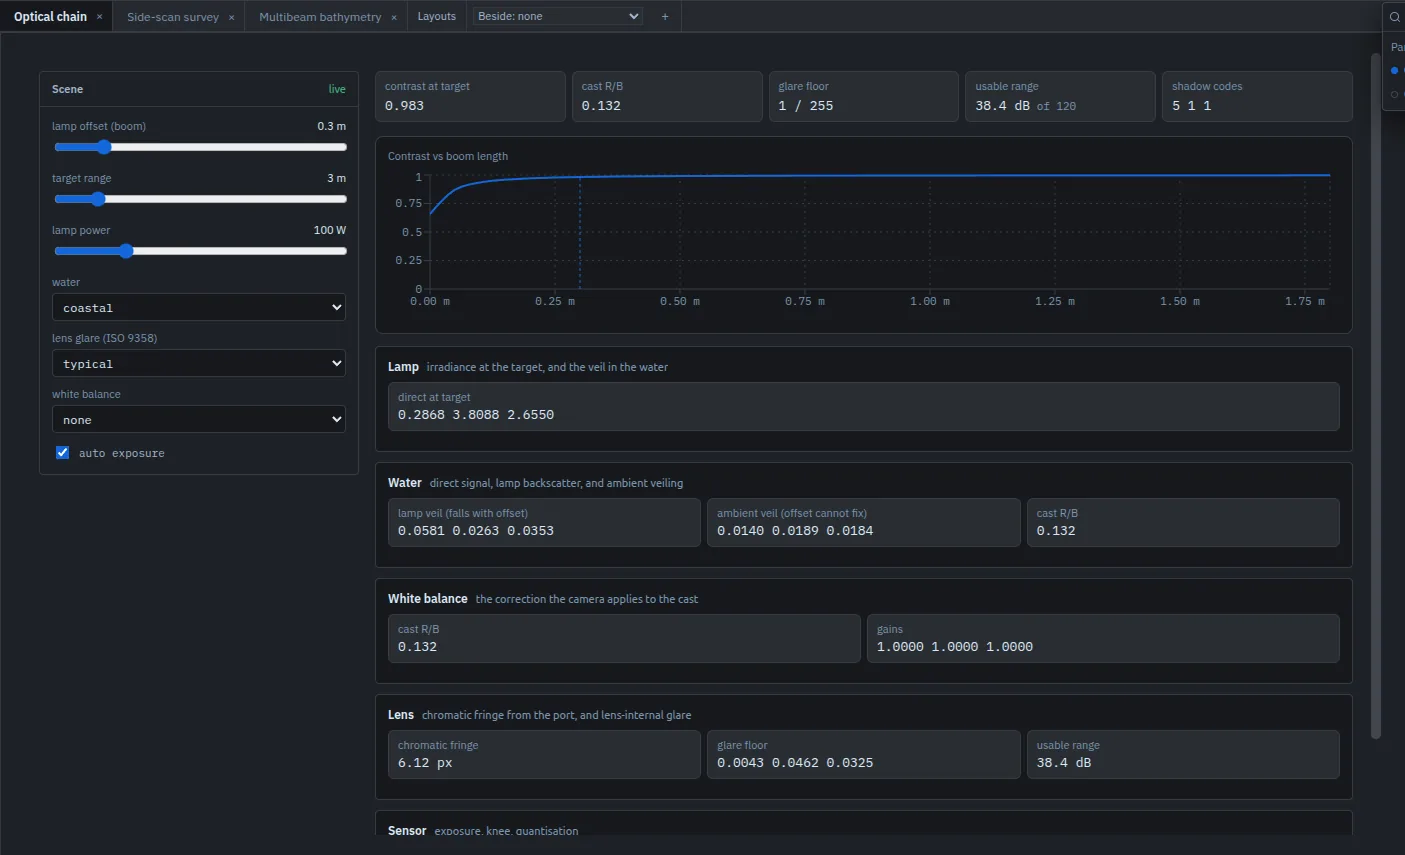
The Optical chain panel explains what an underwater camera with artificial lights can see. Its inputs are lamp offset (boom length), target range, lamp power, water type, lens glare class and white balance. It reports contrast at the target, the red/blue colour cast, the glare floor and usable dynamic range. Its central plot shows why lights go on booms: lamp backscatter falls steeply with offset, while ambient veiling does not change. This is an analytic design aid; artificial lighting is not part of the PerceptionFrame camera model.
Tide
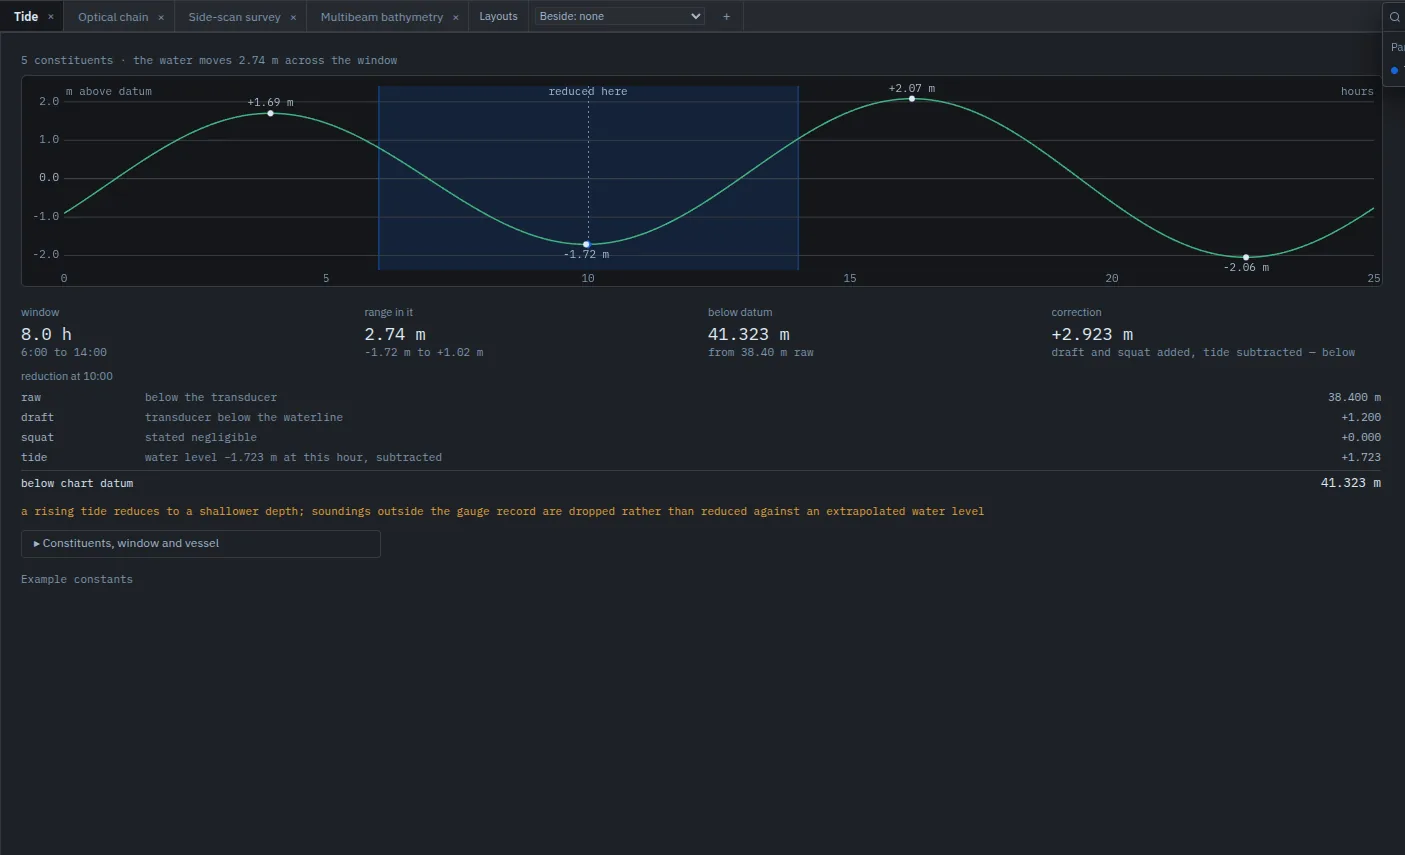
The Tide panel synthesises water level from harmonic constituents over a time window. It shows the range in that window and reduces a sounding to chart datum, including transducer draft and squat. The bundled constants are labelled as examples, not observations for any port.
Nav filter
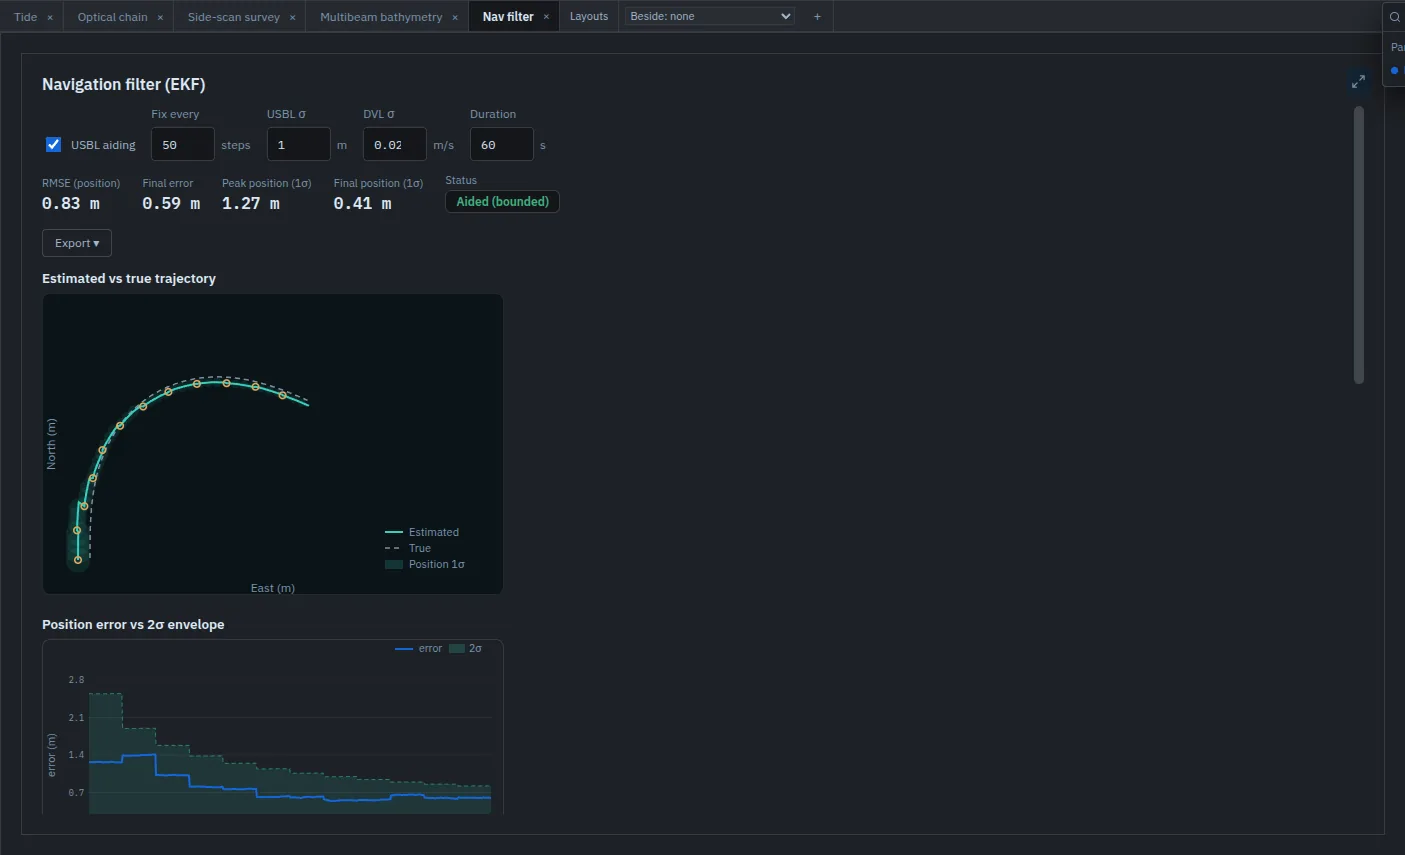
The Nav filter panel runs LEVIATHAN's navigation EKF on simulated sensors and compares the estimate with truth. It reports RMSE, final error, the 1σ envelope, the error distribution and whether USBL aiding keeps the error bounded. See Mapping and navigation.
Reinforcement learning
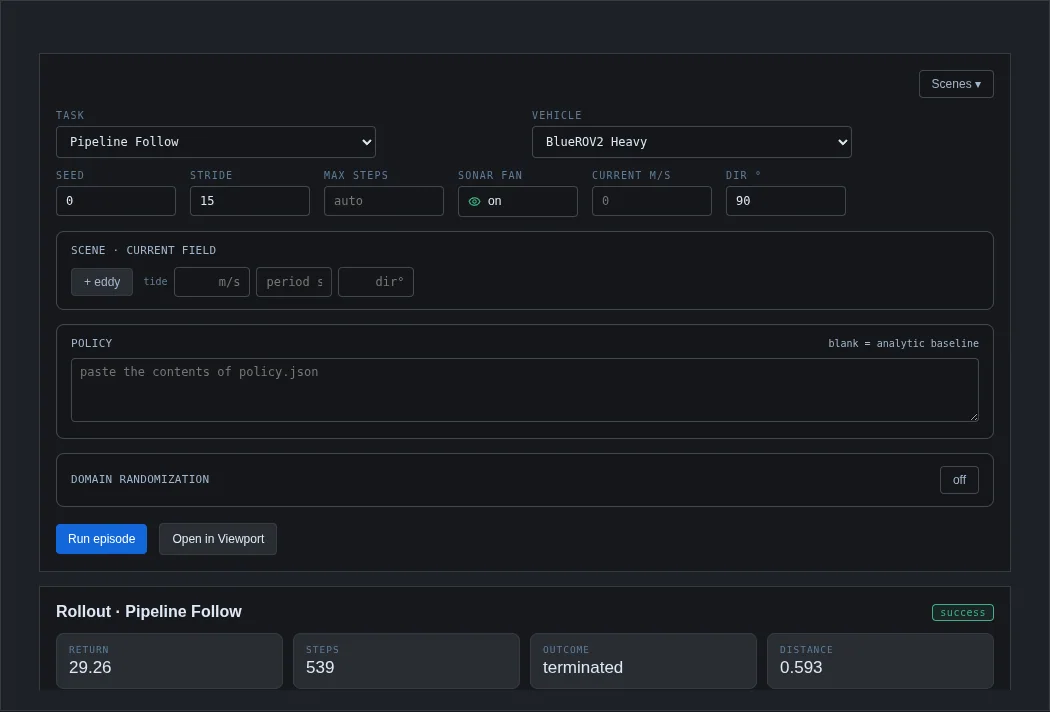
The Reinforcement learning panel runs one episode of a task for a vehicle, with the analytic baseline or a pasted policy, and optional current fields, obstacles and domain randomisation. It plots depth, reward and distance over time and can open the episode in the World.
Interface panels
ROS 2, SITL / HIL, Replay, Author, Scenario graph and Project replaced the application's former Interfaces tab; the panel picker lists them under Other. The ROS 2, SITL / HIL and Replay panels connect the simulation to other software; they are described in Hardware, HIL and interfaces. Author and Scenario graph are scenario-authoring tools. In this release, Author's reward-drafting backend is an offline stand-in. Project links the Dashboard to Code-workspace projects.
- Panels use the analytic tier unless they say otherwise. Their sensor views are models for analysis, not canonical measurements.
- Several panels state their own limits on screen, for example when a fit is not meaningful or constants are examples. Those notes are part of the result.
- SLAM eval scores trajectory estimates on a synthetic range-measurement benchmark. It is an evaluation tool; LEVIATHAN does not include a SLAM system.